
cloudwatch
 CloudWatch Monitoring and Alerting
Agenda
Monitoring and Alerting of AWS resources is performed using AWS’ CloudWatch.
Monitoring involves a related concept called Metrics. Alerting involves a related concept called Alarms. Thus we would get familiar with:
Metrics
Monitoring
Alarms
Alerts
Alerts need to be configured using AWS SNS service. Hence we would also touch upon the following SNS concepts:
Topic
Subscription
We will monitor an EC2 instance in this post. Monitoring can also be configured on other AWS resources like API Gateway, Lambda, S3 etc.
Prerequisites
We will use three AWS services, namely CloudWatch, EC2 and SNS. Hence having a user authorised for these three services would help.
EC2 setup
We are interested in monitoring the CPU Utilisation of an EC2 instance. Hence, we need an EC2 instance.
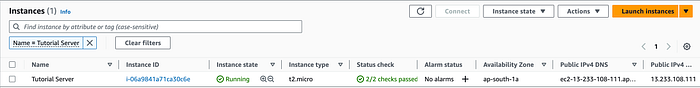
Let’s launch an EC2 t2.micro instance, we can use Ubuntu 22.04 LTS AMI or any other AMI.
We have named our instance Tutorial Server.
Metrics
Monitoring is always performed on a Metric. Some examples of metrics are:
CPU Utilisation
Memory used
Memory available
Bytes read
Bytes written
A useful metric for compute resources is CPU utilisation. As EC2 is a compute service, so let’s focus on CPU utilisation.
CloudWatch provides ability to view metrics for different resources. It can be used to see CPU utilisation of an EC2 instance.
Navigate to CloudWatch > Metrics > All metrics
Metrics are grouped under namespaces.
You would find EC2 under AWS namespaces. As we are interested in an instance metric, thus need to select Per-Instance Metrics.
If you have multiple EC2 instances, metrics for all the instances would show up. Filter by the instance id to view only an instance’s metrics.
You would find a column Metric name. It lists several metrics like CPUUtilization, DiskReadBytes, DiskReadOps etc.
We can select and graph CPUUtilization.
Every data point of this graph shows average cpu utilisation over a 5 minute period. You would notice a difference of 5 minutes between each successive data point.
Let’s check average cpu utilisation every 1 minute rather than 5 minutes. Also, let’s see only last 1 hour data instead of 3 hours. We will have to switch to Graphed Metrics tab.
The graph should start looking like:
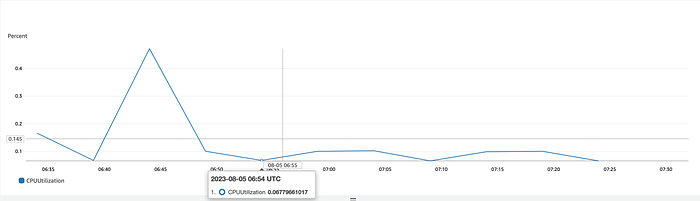
We are working on a brand new EC2 instance which isn’t doing any real work. Hence the CPU utilisation is less than 1 percent.
Stress test
Let’s stress the instance with some real load and see how the CPU utilisation spikes.
stress is a useful tool to subject any machine to real CPU load.
ssh to the instance.
Install stress on the instance.
Let’s perform a stress on the CPU.
This would put load on the CPU for 300 seconds, i.e 5 minutes.
We will check the metric after 5 minutes once stress has completed. Go and grab a coffee in the meanwhile!
Recheck the metric and graph it after 5 minutes. The graph would look similar to the following:
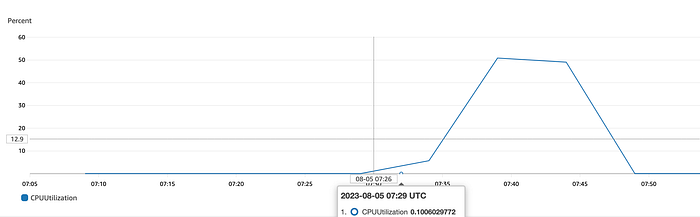
This suggests that during the 5 minute interval that the stress was running, CPU utilisation was 50 percent.
Let’s increase the number of concurrent processes to 4 and run the processes for 10 minutes.
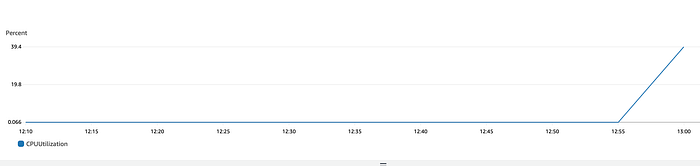
Recheck and graph the metric after 10 minutes. The graph would look similar to the following:
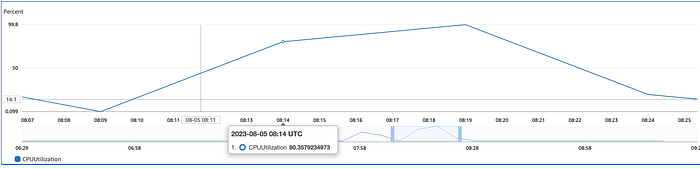
This suggests that during the 10 minutes interval, CPU utilisation reached 80 percent and then went up till more than 99 percent and slowly came down towards 20 percent.
Alarm and Alert
We want to be alerted whenever there is a spike in CPU utilisation. This will allow us to take corrective action like scaling the compute capacity before there is an outage.
The foundation for Alerting is Alarms. Hence, Alarms need to be configured.
The alarm would indicate us that current server resources aren’t sufficient to sustain the load.
We can create an Alarm from Graphed metrics tab.
Alarm creation has three major parts:
Metric
Condition
Action
A CloudWatch Alarm has different states. The two states of interest are OK and In Alarm.
We took the following steps:
We consider our application stable when cpu utilisation stays below 60%. That’s why our alarm has been configured to trigger when the utilisation goes above 60%.
Let’s again run stress for 10 minutes.
Navigate to Metrics and graph the CPUUtilization after few minutes.
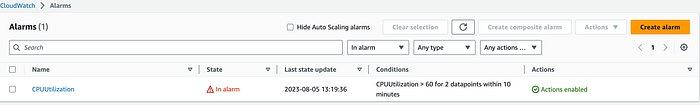
CloudWatch also provides an Alarm list page. Let’s navigate there and see the created Alarm.
We can see the created Alarm named CPUUtilization. Also, the current state of Alarm is shown here which is OK.
Let’s increase the CPU concurrency with stress. This will put additional load on the server CPU.
After 10 minutes, once the relevant data points are published to CloudWatch, check the Alarm page again.
It’s highly likely that the Alarm has transitioned to In alarm state.
Since our Alarm’s action specified a SNS Topic and an Email subscription, you should have received an Email from AWS.
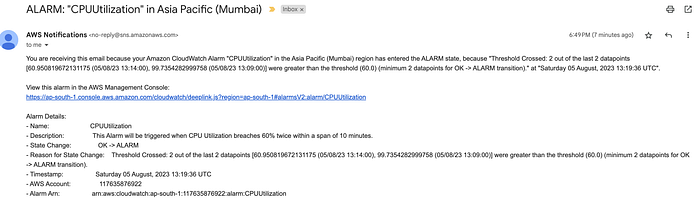
This confirms that our alarm and alerting is working as intended.
Recap
CloudWatch allows users to monitor different resource metrics. Alarms can be configured on the monitored metrics.
When the configured metrics thresholds are breached, the alarm transitions from OK to In Alarm state.
Alerts can be configured to be triggered on alarm transition. A basic alerting mechanism could be sending an email. In AWS, alerts are configured using SNS.